Does Greater Health Mean Greater Wealth? An Analysis of Health Disparities Within Canada.
Does Greater Health Mean Greater Wealth? An Analysis of Health Disparities Within Canada.
Julia Incitti, MSc Candidate, School of Kinesiology
January 22, 2024
In their Global status report on physical activity 2022, the World Health Organization (WHO) identified physical inactivity as the fourth leading risk factor for mortality worldwide. Recent data from the Government of Canada in 2023 suggests almost half of the adults living in Canada are considered inactive, defined as those who engage in less than 150 minutes per week of physical activity. This illustrates a concerning picture for Canadians, worsened by the estimated $2.2 billion in healthcare costs associated with inactivity-related diseases per year (Chaput et al., 2023). Inactive individuals have been shown to have higher rates of chronic diseases (i.e., high blood pressure, diabetes, cardiovascular disease), more mental health issues (i.e., anxiety, depression), and shorter life expectancies compared to those who are regularly active (Reimers et al., 2012).
As winter approaches, many of us may be looking forward to staying inside and cozying up to read our favorite book. Trends of activity levels have been shown to decrease by almost 30% in the winter months for Canadians, while the risk of cardiovascular mortality rises (Merchant et al., 2007). While persistent narratives like “making healthy choices” and “going to the gym” may attempt to mitigate the inactivity crisis during these months, they reveal deeper, unresolved inequities in health risks and ignore the social determinants of health.
Health Inequalities Among Canadians
Increasing the physical activity levels of Canadians has become a major public health objective but this is a challenging task, with many factors influencing inactivity rooted in social and economic inequalities. Current social narratives have become problematic in suggesting it is on an individual solely to influence their health and health risks. For some Canadians, simply “going to the gym” or “eating healthier” may not be possible for a variety of reasons. For example, those in low socioeconomic groups, experience barriers in access to recreational facilities, financial barriers like the cost of sports and gym programs, and have limited social inclusion (Lazar and Davenport, 2018). These all contribute to higher rates of physical inactivity among this population. Those with low socioeconomic status also tend to live in neighborhoods with less open space for parks, lower quality sidewalks, and less bike lanes, demonstrating an inequality the physical environment may introduce.
Education has also been shown to influence health risks and inactivity levels. Higher levels of education are associated with healthier lifestyle choices, like active leisure-time activities. Those with a higher education tend to engage in sports and outdoor activities during their leisure hours more often than those with less education (Piirtola et al., 2016). Education has also been linked to higher-paying occupational positions which are more often desk jobs as opposed to manual labor. Research suggests that harmful working conditions (i.e., exposure to chemicals, loud noises, outdoor extreme temperatures) that those with jobs in mining, manual labor, and manufacturing experience have created health disparities among the employed populations (Burgard and Lin, 2013).
This highlights the factors like income, education, occupation, and socioeconomic status that have been shown to play a role in determining an individual’s inactivity levels and health behaviors. These factors are referred to as the social determinants of health and can be defined as “the conditions in which people are born, grow, work, live, and age in” (World Health Organization, 2022). These determinants of health are seldom acknowledged in society, reflected by the social narratives we continue to see.
Health inequalities in physical activity engagement exist between different social categories as well. In Canada, for example, evidence shows that men tend to engage in more physical activity than women (Abichahine and Veenstra, 2016). In terms of ethnicity, one study found that almost half of White Canadians engage in moderate forms of physical activity while only 38% of Black Canadians and 34% of South Asian Canadians do (Bryan et al., 2006). If we look at age disparities, inactivity prevalence increases substantially for Canadians over the age of 50, with higher levels in women and non-white populations (Centers for Disease Control and Prevention, 2021).
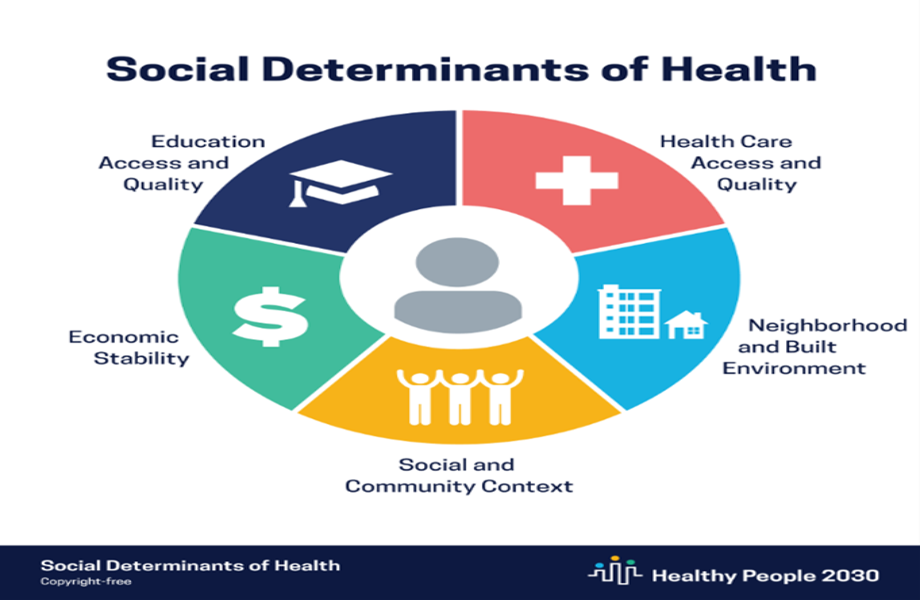
Figure 1: The social determinants of Health (U.S. Department of Health and Human Services, n.d.)
A Final Note
Examining the health disparities between different groups concerning inactivity has demonstrated that those with greater wealth and higher social status experience lower rates of inactivity and its associated negative health outcomes. The social determinants of health reveal the unequal distribution of health risks and outcomes for Canadians still present in 2023. Women, ethnic minorities, and those with low social status are not able to achieve the same levels of physical activity as the rest of the population, ultimately increasing their chances of developing inactivity-linked diseases and negative health outcomes. Healthcare interventions and organizations involved with healthcare promotion need to focus on efforts that reduce these inequalities and the wider determinants of an individual’s life that impact their health. Further, the social narrative around inactivity must reflect an acknowledgement for factors beyond an individual’s immediate control that lead to health choices and behaviours.
References
Abichahine, H., & Veenstra, G. (2016). Inter-categorical intersectionality and leisure-based physical activity in Canada. Health Promotion International. https://doi.org/10.1093/heapro/daw009
Bryan, S. N., Tremblay, M. S., Pérez, C. E., Ardern, C. I., & Katzmarzyk, P. T. (2006). Physical activity and ethnicity. Canadian Journal of Public Health, 97(4), 271–276. https://doi.org/10.1007/bf03405602
Burgard, S. A., & Lin, K. Y. (2013). Bad jobs, bad health? how work and working conditions contribute to health disparities. American Behavioral Scientist, 57(8), 1105–1127. https://doi.org/10.1177/0002764213487347
Chaput, J.-P., Janssen, I., Lang, J. J., & Sampasa-Kanyinga, H. (2023). Economic burden of excessive sedentary behaviour in Canada. Canadian Journal of Public Health, 114(2), 165–174. https://doi.org/10.17269/s41997-022-00729-2
Centers for Disease Control and Prevention. (2021). MMWR data highlights. Centers for Disease Control and Prevention. https://www.cdc.gov/physicalactivity/inactivity-among-adults-50plus/mmwr-data-highlights.html#:~:text=Inactivity%20prevalence%20significantly%20increased%20with,chronic%20disease%20than%20their%20counterparts.
Global status report on physical activity 2022. (2022). World Health Organization.
Government of Canada. (2023). Tracking Health Through Daily Movement Behaviour: Data blog. Canada.ca. https://health-infobase.canada.ca/datalab/pass-blog.html
Lazar, M., & Davenport, L. (2018). Barriers to health care access for low income families: A review of literature. Journal of Community Health Nursing, 35(1), 28–37. https://doi.org/10.1080/07370016.2018.1404832
Piirtola, M., Kaprio, J., Kujala, U. M., Heikkilä, K., Koskenvuo, M., Svedberg, P., Silventoinen, K., & Ropponen, A. (2016). Association between education and future leisure-time physical inactivity: A study of Finnish twins over a 35-year follow-up. BMC Public Health, 16(1). https://doi.org/10.1186/s12889-016-3410-5
Merchant, A. T., Dehghan, M., & Akhtar-Danesh, N. (2007). Seasonal variation in leisure-time physical activity among Canadians. Canadian Journal of Public Health, 98(3), 203–208. https://doi.org/10.1007/bf03403713
Reimers, C. D., Knapp, G., & Reimers, A. K. (2012). Does physical activity increase life expectancy? A review of the literature. Journal of Aging Research, 2012, 1–9. https://doi.org/10.1155/2012/243958
Photo by Jason Leung on Unsplash